

Application Case: Real-time Well Testing & Prod Optimization
Field Information:
- Field: Zelten
Background:
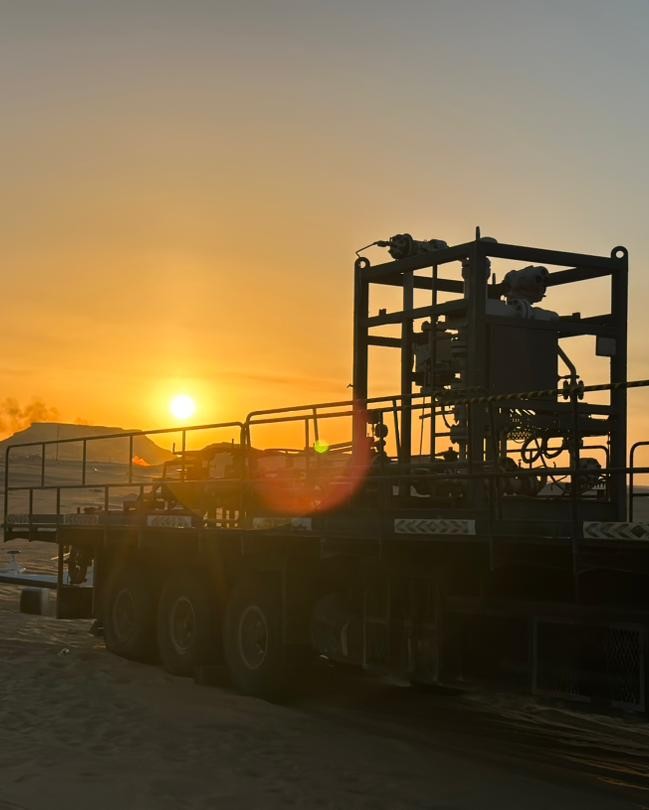
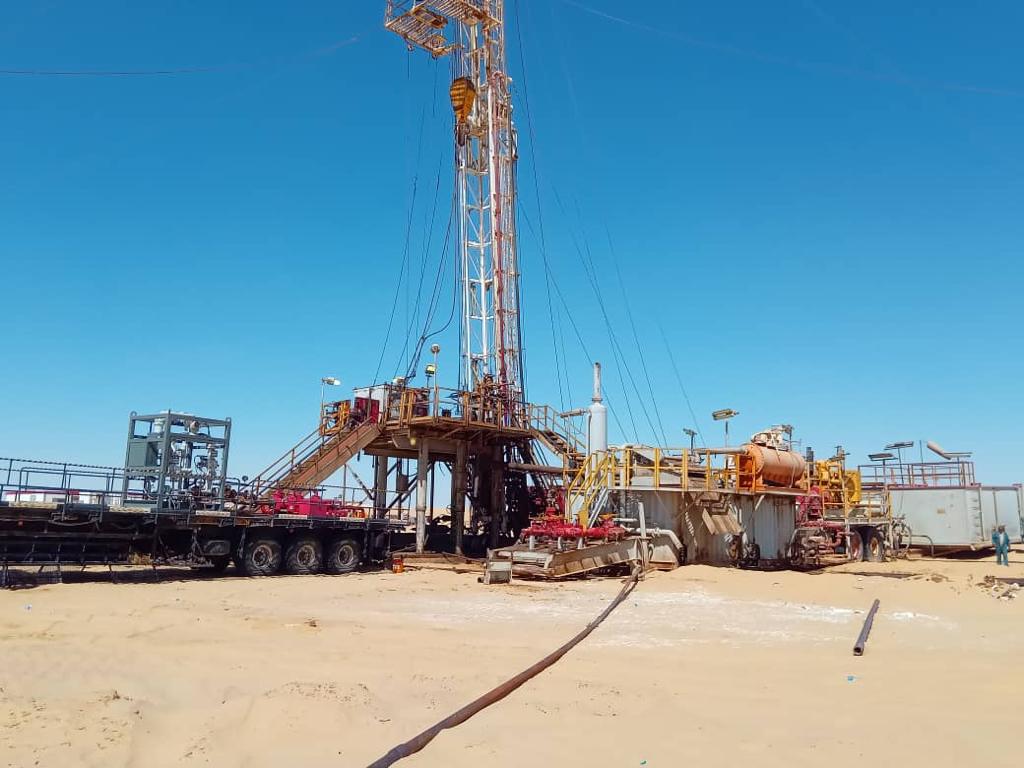
- On April 16, 2025, a multi-rate test was conducted on Well X3, a Gas Lift operated well, using MPFM Unit #10.
Challenges:
- assess the well's performance and explore possibilities for enhancing its productivity.
Solution:
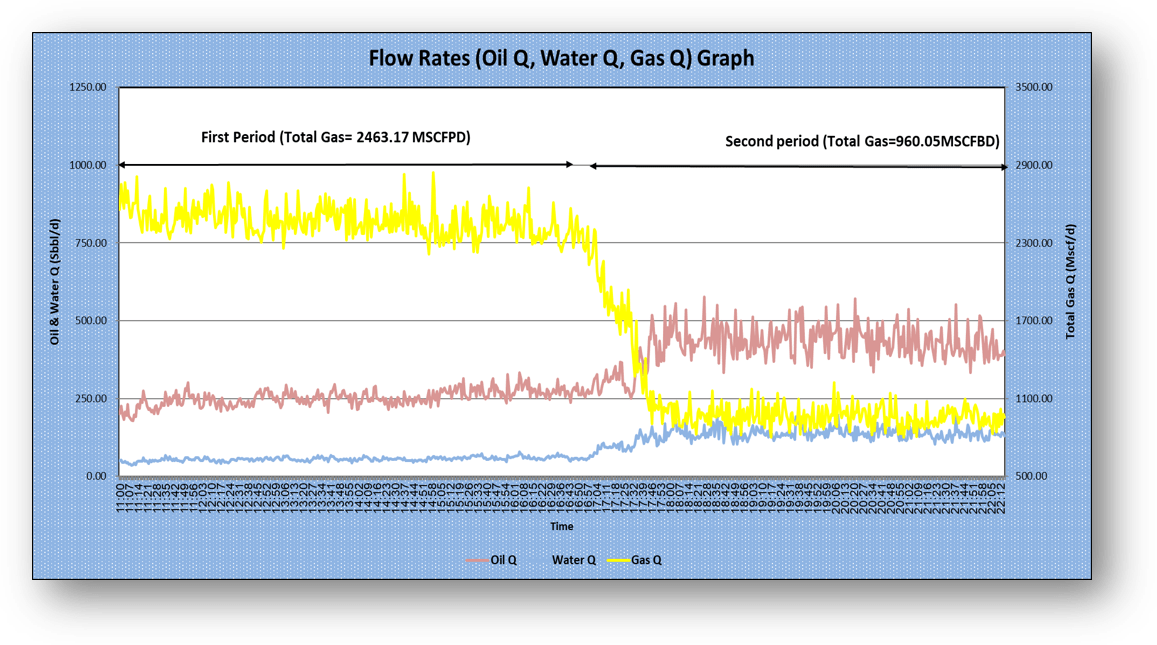
- the decrease in gas injection cause increase in oil flow rate about 1810.74 Sbbl/d.
| Time (APR-2025) |
Gas Injection (MSCFPD) | Liquid Flow Rate (Bpd) | Oil Flow Rate (Sbbl/D) | WC % |
|---|---|---|---|---|
| 11:00-17:00 | 2463.17 | 309.35 | 253.56 | 18.04% |
| 18:15-4:00 | 960.05 | 574.63 | 435.3 | 24.24% |

Akakus Oil Operation
ESP Optimization for New Well at El-Sharara Field by Using MPFM.

Waha Oil
Company
Evaluate a re-designed wells and their new performance.

Zallaf Libya
Oil and Gas
Comparative Evaluation of Multiphase Flow Meters at Chadar Field Using Expro and WOC Test Separators.
See more →